LAHSA is STEAM certified by LAUSD, Gold Certified by Linked Learning Alliance, and boasts of an 81% graduation rate and a 27% AP Course Enrollment (as of 2019). The student-teacher ratio is 16:1. Roughly 13% of the student population has a disability.
Demographics of LAHSA
Socioeconomic Status
According to the California School Dahsboard, in 2022, nearly all (96.6%) of LAHSA's student population qualified as "socioeconomically disadvanged". Likewise, about 94% of all students qualifed for free or reduced-priced meals, according to Ed-Data. This data has stayed relatively consistent since 2017.
English Learners
About one in every five (21.3%) of all LAHSA students are English Leaners, almost all of which speak Spanish as their home language (L1). The CA Dashboard reports that a high rate of English Learners are reclassifed as proficient (RFEP) each year. More than half of all EL students progress at least one English Learner Progress Indicator (ELPI) Level every year.
Academic Performance
English Language Arts
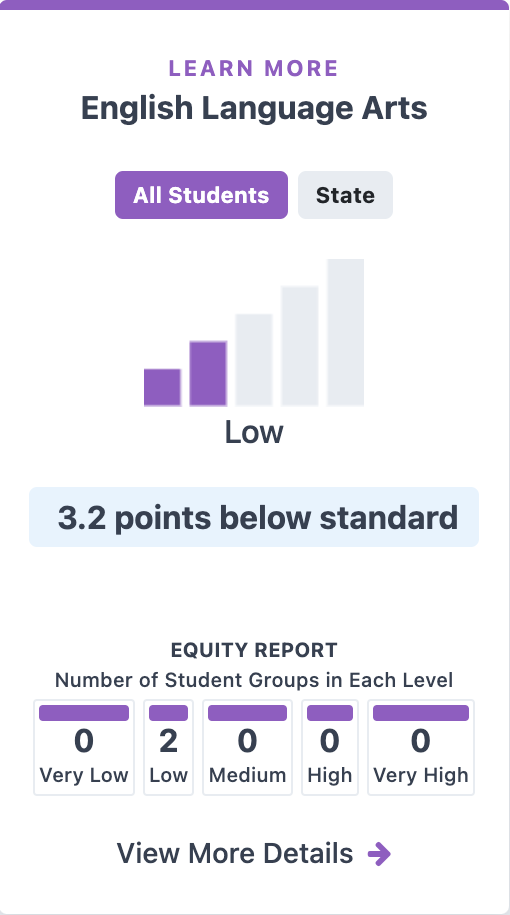
According to the California School Dashboard, LAHSA's performance on standardized English tests as "low" - 3.2 points below the standard
About one-quarter of LAHSA students did not meet the CAASPP (California Assessment of Student Performance and Progress) standard. This data has stayed relatively consistent since 2017. English Learners did not meet the standard at a higher rate than their English Proficient schoolmates. There are gaps in the data, most likely due to COVID-19.
Mathematics
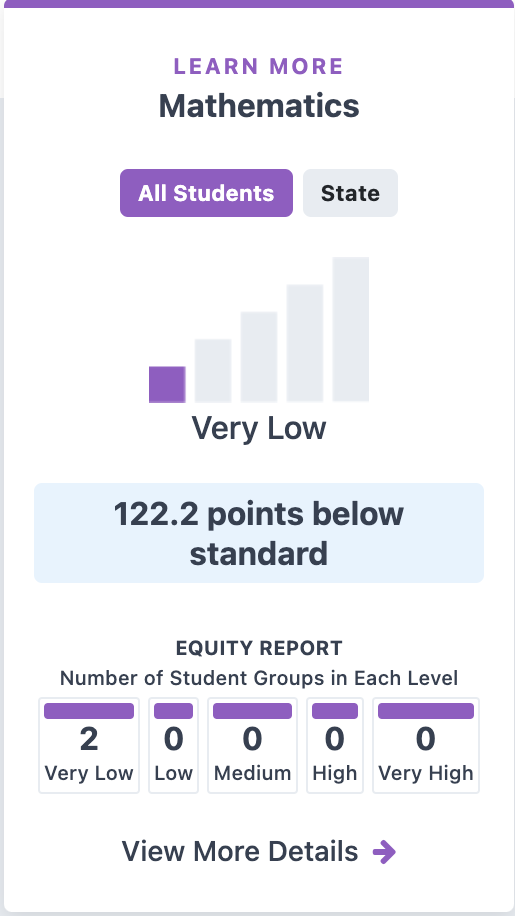
According to the California School Dashboard, LAHSA's performance on standardized Mathematics tests was " very low" - 122.2 points below the standard
More than half of all LAHSA students did not meet the CAASPP standard for mathematics. This data has stayed relatively consistent since 2017. English Learners did not meet the standard at much higher rates than their English Proficient schoolmates. There are gaps in the data, most likely due to COVID-19.
Physical Fitness
LAHSA 9th graders have higher rates of flexibility and trunk extension strength than aerobic capacity and upper body strenth. About 27% of students have a health risk due to body composition, and about 15% of students have a health risk due to aerobic capacity. However, physical fitness tests were not conducted during the COVID-19 pandemic.


